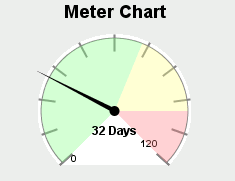
用JFreeChart画仪表盘(Speedo Meter Chart)的例子:
DefaultValueDataset data = new DefaultValueDataset(32.0);
MeterPlot plot = new MeterPlot(data);
plot.setDialShape(DialShape.CHORD);
plot.setDialBackgroundPaint(Color.WHITE);
plot.setRange(new Range(0, 120));
plot.setDialOutlinePaint(Color.GRAY);
plot.setNeedlePaint(Color.BLACK);
plot.setTickLabelsVisible(true);
plot.setTickLabelPaint(Color.BLACK);
plot.setTickPaint(Color.GRAY);
plot.setTickLabelFormat(NumberFormat.getNumberInstance());
plot.setTickSize(10);
plot.setValuePaint(Color.BLACK);
plot.addInterval(new MeterInterval("Low", new Range(0, 70), null, null,new Color(128, 255, 128,90) ));
plot.addInterval(new MeterInterval("Normal", new Range(70, 100), null, null, new Color(255, 255, 128,90)));
plot.addInterval(new MeterInterval("High", new Range(100, 120), null, null, new Color(255, 128, 128,90)));

//创建chart,最后一个参数决定是否显示图例
final JFreeChart chart = new JFreeChart("Meter Chart", JFreeChart.DEFAULT_TITLE_FONT, plot, false);

//放到SWT的Composite里,以前介绍过这个方法
Composite drawarea = new Composite(tabFolder, SWT.EMBEDDED);
drawarea.setLayout(new FillLayout());
Frame canvasFrame = SWT_AWT.new_Frame(drawarea);
java.awt.Canvas canvas = new java.awt.Canvas() {
    public void paint(Graphics g) {
        super.paint(g);
        if (chart != null)
            chart.draw((Graphics2D) g, getBounds());
    }
};
TabItem tab = new TabItem(tabFolder, SWT.NONE);
tab.setControl(drawarea);
tab.setText("Meter");
canvasFrame.add(canvas);
运行效果:

搬家前链接:https://www.cnblogs.com/bjzhanghao/archive/2007/03/13/673303.html
欢迎转载
请保留原始链接:https://bjzhanghao.cn/p/2741
请保留原始链接:https://bjzhanghao.cn/p/2741